
For a long while, I’ve used munin along with a few custom made munin plugins to monitor a server of mine. Recently however, there’s been a few interesting new offerings on the market that aim to make monitoring more flexible, so I decided to give it a go.
I quickly ended up with collectd as the monitoring agent, given it’s extremely lightweight, around for more than 10 years. It also supports sending its collected data in numerous different formats, making my choice on the server side more or less independent.
For starters, I tried the ELK stack. However, given that I’m particularly conscious of resource usage, I had to eliminate this early on. In my setup, with which I’m using a sole and small monitoring server, it was impossible to get ElasticSearch to run for more than a couple of days before running out of heap space. The week that I’ve been running and testing it though made me realise Kibana is just too complex to configure, given that all I need is something similar to my good old and simple munin.
Having done more experiments with Graphite (a bit complex to setup), and collectd with GraphZ (more or less similar output as with munin), I ended up installing InfluxDB and Grafana.
Installing influxDB
Since I’m on Debian, I’m doing the following, in line with the downloads page:
$ sudo dpkg -i influxdb_1.1.0_amd64.deb
This installs the service influxdb, with the CLI executable available at /usr/bin/influx. The configuration file can be found at /etc/influxdb/influxdb.conf.
The latter must be modified first, to enable gather metrics coming from collectd agents.
[collectd]
    enabled = true
    bind-address = "127.0.0.1:25826"
    database = "collectd"
    typesdb = "/usr/share/collectd/"

Note that you need to change the template value of the enabled property to true (apart from uncommenting). I have also had to modify the typesdb property to a directory, telling InfluxDB to load all files as types.db definitions. This is necessary if you have custom types (which you'd define in collecd.conf with separate typedb properties).
Next, we start the service, enabling influxdb to start gathering metrics on collectd’s default port:
sudo service influxdb startYou can subsequently check if metrics are succesfully retrieved by InfluxDB as follows:
$ sudo influx -precision rfc3339Visit https://enterprise.influxdata.com to register for updates, InfluxDB server management, and monitoring. Connected to http://localhost:8086 version 1.1.0 InfluxDB shell version: 1.1.0 > use collectd Using database collectd > show measurements name: measurements name ---- apache_value cpu_value curl_json_value curl_value df_value disk_read
(Note how I added the rfc3339 precision, to make sure that timestamps in the measurements are readable)
If you have no measurements listed, you’ll have to work out where things are going wrong. Chances are you need to open up the firewall to accept incoming traffic on the collectd port.
So far so good. Metrics are being gathered, but we obviously need to seem the as well. This is where the Grafana dashboard comes in. I’ll use this, rather than the recently open-sourced Chronograph, as it is still more feature rich. There’s still room to switch over later on while retaining InfluxDB as the data container.
Installing Grafana
Just like with Influx, the documentation is clear. I decided to use the APT repository. For Debian, I have to add the grafana repository to my /etc/apt/sources.list , but on Ubuntu 16.04, Grafana can be installed from the available packages:
$ sudo apt-get update
$ sudo apt-get install grafana
Start up the service:
$ sudo service grafana-server start
By default, this starts the grafana web interface on port 3000, so you could go and check grafana at http://localhost:3000.
I found this a bit impractical, and therefore decided to proxy it through nginx. For this, I needed to adapt both the configuration of grafana, as well as of nginx.
I added the following to my /etc/nginx/sites-enabled/nginx.conf file:
        location /grafana/ {
                proxy_pass              http://127.0.0.1:3000/;
        }
And in /etc/grafana/grafana.conf, modified the root_url property:
root_url = %(protocol)s://%(domain)s:%(http_port)s/grafana
Restart both to apply the changes, after which I could navigate to localhost/grafana to see the grafana login screen.
$ sudo service grafana-server start
$ sudo service nginx restart
The default login for grafana is admin / admin, but you can change this in the grafana configuration file. Once logged in, you’ll need to add your data source. For me, the settings look as follows:
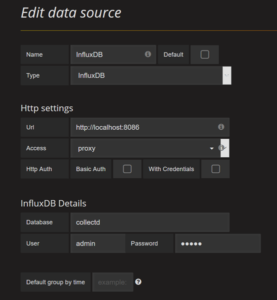
InfluxDB datasource configuration
This brings us to a point where we can start setting up some graphs in Grafana. I’ll follow this up with some example graphs in a new post.